Trading Charts Review

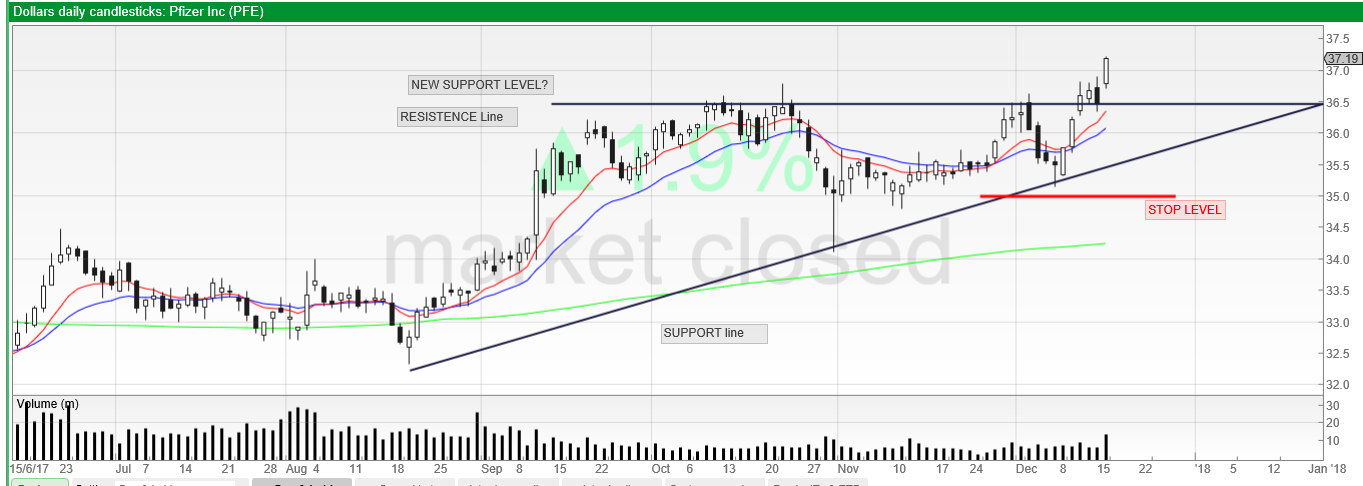
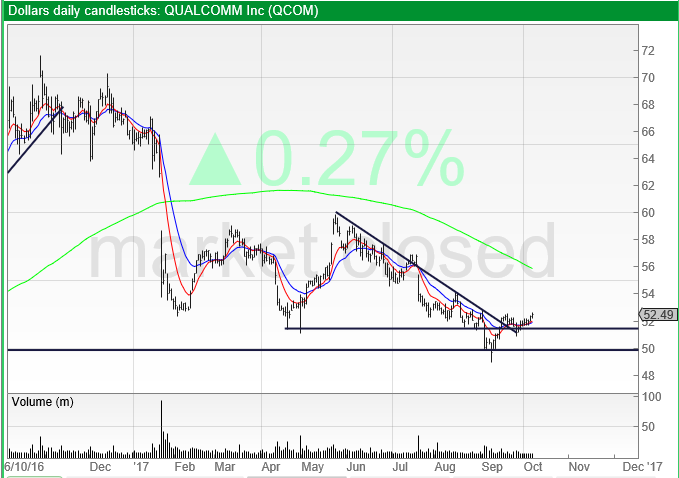
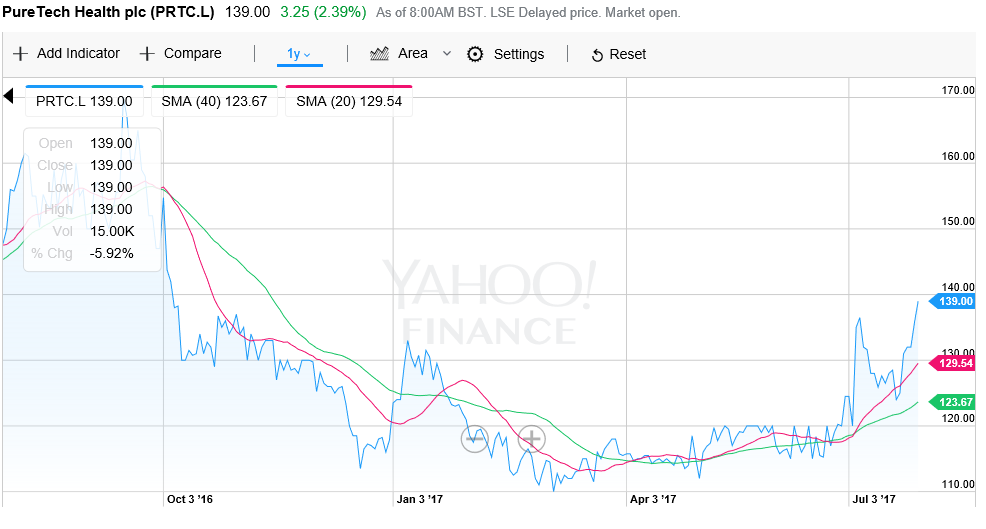
Please note these trading charts are not stock recommendations but are examples of chart patterns and stock price trends. Care is taken to provide accurate information but you should always check data yourself before making any decisions or seek professional financial advice.

Sunday, 24 December 2017

PureTech Health PRTC Trading Chart


Puretech Health Latest Trading Chart

Puretech Website link
Posted by Hugh Spencely No comments:
Email ThisBlogThis!Share to XShare to FacebookShare to Pinterest
Labels: PRTC, Puretech

Sunday, 17 December 2017

PFIZER PFE Trading Chart Review


PFIZER Latest Trading Cart

PFIZER Website Link
Posted by Hugh Spencely No comments:
Email ThisBlogThis!Share to XShare to FacebookShare to Pinterest
Labels: PFE, pfizer

Sunday, 10 December 2017

MoneySuperMarket MONY Trading Chart Review


MONY Latest Chart Link

MoneySuperMarket Website Link

Posted by Hugh Spencely No comments:
Email ThisBlogThis!Share to XShare to FacebookShare to Pinterest
Labels: MoneySuperMarket, MONY

Saturday, 2 December 2017

Premier Oil PMO Trading Chart Review


Latest Trading Chart Link

Premier Oil Website Link
Posted by Hugh Spencely No comments:
Email ThisBlogThis!Share to XShare to FacebookShare to Pinterest
Labels: PMO, Premier Oil

Sunday, 26 November 2017

SHIP Finance SFL Trading Chart Review


SHIP Latest Chart Link

SHIP Finance Website Link
Posted by Hugh Spencely No comments:
Email ThisBlogThis!Share to XShare to FacebookShare to Pinterest
Labels: Sea Energy Marinetime, SFL

Sunday, 19 November 2017

Exxon Mobil Trading Chart Review XOM


Exxon Mobil Latest Trading Chart

Exxon Mobil Website Link
Posted by Hugh Spencely No comments:
Email ThisBlogThis!Share to XShare to FacebookShare to Pinterest
Labels: Exxon Mobil, XOM

Sunday, 12 November 2017

Animal Care ANCR Trading Chart Review


ANCR Latest Trading Chart Link

ANCR Website Link
Posted by Hugh Spencely No comments:
Email ThisBlogThis!Share to XShare to FacebookShare to Pinterest
Labels: ANCR, Animal Care

Sunday, 5 November 2017

Editas EDIT Trading Chart Review


Editas Latest Chart Link

Editas EDIT Website link
Posted by Hugh Spencely No comments:
Email ThisBlogThis!Share to XShare to FacebookShare to Pinterest
Labels: EDIT, Editas

Sunday, 29 October 2017

Autonation AN Trading Chart Review


Autonation Latest Trading Chart

Autonation Website Link
Posted by Hugh Spencely No comments:
Email ThisBlogThis!Share to XShare to FacebookShare to Pinterest
Labels: AN, Autonation

Sunday, 22 October 2017

Agnico Eagle Mines Ltd Trading Chart


AEM Latest Trading Chart

Agnico AEM Website

Posted by Hugh Spencely No comments:
Email ThisBlogThis!Share to XShare to FacebookShare to Pinterest

Sunday, 15 October 2017

Marvel MRVL Trading Chart Review - long Term View


Marvel MRVL Latest Trrading Chart

|Marvel MRVL Website Link

Posted by Hugh Spencely No comments:
Email ThisBlogThis!Share to XShare to FacebookShare to Pinterest
Labels: Marvel, MRVL

Saturday, 7 October 2017

Qualcomm Trading Chart Review


QCOM Latest Trading Chart

Qualcomm Website Link

Posted by Hugh Spencely No comments:
Email ThisBlogThis!Share to XShare to FacebookShare to Pinterest
Labels: QCOM, Qualcomm

Sunday, 1 October 2017

VANDA VNDA Trading Chart review


VNDA Latest Trading Chart

VNADA Website Link

Posted by Hugh Spencely No comments:
Email ThisBlogThis!Share to XShare to FacebookShare to Pinterest
Labels: VANDA chart, VNDA

Sunday, 24 September 2017

Morrison's MRW Trading Chart review


Morrisons Latest Trading Chart

Morrison's Website Link
Posted by Hugh Spencely No comments:
Email ThisBlogThis!Share to XShare to FacebookShare to Pinterest
Labels: Morrison's, MRW

Sunday, 17 September 2017

Fresnillo FRES Trading Chart review


Fresnillo FRES Latest Trading Chart

Fresnillo FRES Website
Posted by Hugh Spencely No comments:
Email ThisBlogThis!Share to XShare to FacebookShare to Pinterest
Labels: FRES, Fresnillo

Sunday, 10 September 2017

Procter & Gamble PG Chart Review - New 52 week High


Proctor & Gamble PG Latest Trading Chart

Procter & Gamble Website
Posted by Hugh Spencely No comments:
Email ThisBlogThis!Share to XShare to FacebookShare to Pinterest

Sunday, 3 September 2017

Oracle Trading Chart Review ORCL


ORACLE ORCL Latest Trading Chart

ORACLE Web Site
Posted by Hugh Spencely No comments:
Email ThisBlogThis!Share to XShare to FacebookShare to Pinterest
Labels: ORACLE, ORCL

Sunday, 27 August 2017

EATON Corp. ETN Trading Chart


EATON ETN Latest Trading Chart

EATON Corp. Website
Posted by Hugh Spencely No comments:
Email ThisBlogThis!Share to XShare to FacebookShare to Pinterest

Sunday, 20 August 2017

Kulicke & Soffa Industries KLIC Trading Chart


KLIC Website

KLIC Latest Trading Chart


Posted by Hugh Spencely No comments:
Email ThisBlogThis!Share to XShare to FacebookShare to Pinterest

Sunday, 13 August 2017

Taylor Wimpey Trading Chart Review


Taylor Wimpey Latest Chart

Taylor Wimpey Website
Posted by Hugh Spencely No comments:
Email ThisBlogThis!Share to XShare to FacebookShare to Pinterest
Labels: Taylor Wimpey Chart Review. TW

Thursday, 3 August 2017

Van Elle trading chart moves up


Van Elle Latest Chart

Van Elle Website
Posted by Hugh Spencely No comments:
Email ThisBlogThis!Share to XShare to FacebookShare to Pinterest
Labels: Van Elle, Van Elle Chart, Vanl

Friday, 28 July 2017

PureTech Health PRTC Trading chart - potential change to upside


PureTech Latest Trading chart

PureTech Website

Posted by Hugh Spencely No comments:
Email ThisBlogThis!Share to XShare to FacebookShare to Pinterest
Labels: PRCT chart, PRTC, PureTech Chart

Saturday, 22 July 2017

Gilead GILD Trading Chart - potential recovery


Gilead GILD Latest Trading Chart

Gilead Website
Posted by Hugh Spencely No comments:
Email ThisBlogThis!Share to XShare to FacebookShare to Pinterest
Labels: GILD Chart, Gilead Trading Chart

Tuesday, 18 July 2017

Consol Energy Trading Chart CNX - potential reversal to upside


Consol Energy CNX Latest Trading Chart
Posted by Hugh Spencely No comments:
Email ThisBlogThis!Share to XShare to FacebookShare to Pinterest
Labels: CNX, CNX Trading Chart, Consol Energy

Saturday, 15 July 2017

Meet Group Trading chart - Potential to move to the upside


Meet Group Latest Chart
Posted by Hugh Spencely No comments:
Email ThisBlogThis!Share to XShare to FacebookShare to Pinterest
Labels: Meet Group Chart, Meet Me chart, MEET.

Tuesday, 11 July 2017

Cree Trading chart - possible Break Out to upside


CREE Chart Updates
Posted by Hugh Spencely No comments:
Email ThisBlogThis!Share to XShare to FacebookShare to Pinterest
Labels: Cree, Cree chart, Cree trading chart
Newer Posts Older Posts Home
Subscribe to: Posts (Atom)

Trading Indicies Charts

  • UK FTSE
  • US DOW
  • US NASDAQ
  • US S&P

Trading Commodity Charts

  • Crude Oil Chart
  • Gold Chart
  • Silver Chart

Trading Sector Charts

  • Consumer Discretionaries
  • Consumer Staples
  • Energy
  • Financials
  • Healthcare
  • Industrials
  • Materials
  • Technology
  • Utilities

Trading Currency Charts

  • EUR/JPY
  • GBP/USD
  • USD/JPY

Country Index

  • Brazil

Search This Blog

What we talk about

  • 2013 trading charts review break outs (1)
  • 52 week high (1)
  • Aeronironment (1)
  • AGL (1)
  • AN (1)
  • ANCR (1)
  • Angle (1)
  • Animal Care (1)
  • Apple Chart (1)
  • Autonation (1)
  • AVAV (1)
  • AVAV chart break resistance upward trend potential (1)
  • B&M (1)
  • Best Buy breakout (1)
  • Blackberry (BBRY) RIMM (1)
  • BME (1)
  • Cameco trading chart CCJ (1)
  • Canadian Natrual Resources Trading Chart (1)
  • CAPE ratio (1)
  • CDE Chart (1)
  • CINE (1)
  • Cineworld (1)
  • CMS (1)
  • CMS Energy (1)
  • CNR (1)
  • CNX (1)
  • CNX Trading Chart (1)
  • Coeur (1)
  • Condor Gold (1)
  • Consol Energy (1)
  • Cotton ETF chart (1)
  • Cree (1)
  • Cree chart (1)
  • Cree trading chart (1)
  • Cumulus radio chart (1)
  • EDIT (1)
  • Editas (1)
  • Exchange Traded Funds and Commodities (1)
  • Exxon Mobil (1)
  • fear guage (1)
  • Financial Trading Chart Kingfisher potential breakout (1)
  • First Solar (1)
  • Ford Chart (1)
  • FRES (1)
  • Fresnillo (1)
  • FSLR (1)
  • FUM (1)
  • Futura Medical (1)
  • Galliford Try (1)
  • GFRD (1)
  • GILD Chart (1)
  • Gilead Trading Chart (1)
  • Gold Trading Chart Update (1)
  • Hamrony Gold (1)
  • HMY (1)
  • Icahn Enetrprise (1)
  • ICG Trading Chart (1)
  • IEP (1)
  • IH20 Global Water ETF trading chart information (1)
  • IJPN ETF CHART (1)
  • India Capital Grouth Fund (1)
  • Intrexon Trading chart (1)
  • IP Group (1)
  • IPO (1)
  • IPO.L IPO trading chart support resistance (1)
  • japan ETF Chart (1)
  • JP Morgan Chart (1)
  • LAND (1)
  • Land Securities (1)
  • Marathon Petroleum (1)
  • Marvel (1)
  • Meet Group Chart (1)
  • Meet Me chart (1)
  • MEET. (1)
  • MGM (1)
  • MGM Resorts (1)
  • MoneySuperMarket (1)
  • MONY (1)
  • Morrison's (1)
  • MPC (1)
  • MRVL (1)
  • MRW (1)
  • O'Higgins Method (1)
  • ORACLE (1)
  • ORCL (1)
  • PFE (1)
  • pfizer (2)
  • Pfizer trading chart (1)
  • PMO (1)
  • PRCT chart (1)
  • Premier Oil (1)
  • PRTC (2)
  • Puretech (1)
  • PureTech Chart (1)
  • QCOM (1)
  • Qihoo 360 Technology (1)
  • QIHU (1)
  • QIHU Chart (1)
  • Qualcomm (1)
  • S&P (1)
  • S&P 500 (1)
  • Sea Energy Marinetime (1)
  • Seattle Genetics (1)
  • SFL (1)
  • SGEN (1)
  • shiller index. Shiller chart. (1)
  • Shiller PE Ratio (1)
  • Shiller PE10. (1)
  • SLCA (1)
  • SLP (1)
  • SNAP (1)
  • Sylvania Platinum (1)
  • Taylor Wimpey Chart Review. TW (1)
  • trading chart (1)
  • US Silica Holdings (1)
  • Van Elle (1)
  • Van Elle Chart (1)
  • VANDA chart (1)
  • Vanl (1)
  • Vivendi (1)
  • VIX (1)
  • VNDA (1)
  • VOD (1)
  • Vodafone (1)
  • Volitility Index (1)
  • Wipro (1)
  • WOOD Global Timber & Forestry ETF (1)
  • XOM (1)
  • XON chart (1)
  • XON. (1)
  • yahoo chart (1)
  • yahoo prices. yahoo 52 week high. (1)
  • Yahoo trading chart (1)

Popular Posts

  • First Solar FSLR Looks like a new Uptrend
  • Angle Plc Trading Chart Review
    Angle Latest trading Chart Angle Website Link
  • SNAP Trading Chart Review
    SNAP Latest Trading Chart SNAP Website Link
  • Wipro Trading chart
    Wipro Latest Trading Chart Wipro Website Link
  • MGM Resorts Trading Chart Review
    MGM Latest Trading Chart MGM Website Link
  • Sylvania Platinum SLP Trading Chart
    Sylvania Latest Chart Sylvania Website Link
  • CMS Energy Trading Chart Review
    CMS Latest Trading Chart CMS Website Link
  • US Silica Holdings Trading Chart
    SLCA Latest Trading chart US Silica Website link
  • PureTech Health PRTC Trading Chart
    Puretech Health Latest Trading Chart Puretech Website link
  • Cineworld Trading Chart Review CINE
    Cineworld Latest Trading Chart Link CineWorld Website Link

Blog Archive

  • ►  2020 (1)
    • ►  June (1)
  • ►  2018 (22)
    • ►  June (1)
    • ►  May (4)
    • ►  April (5)
    • ►  March (4)
    • ►  February (4)
    • ►  January (4)
  • ▼  2017 (26)
    • ▼  December (4)
      • PureTech Health PRTC Trading Chart
      • PFIZER PFE Trading Chart Review
      • MoneySuperMarket MONY Trading Chart Review
      • Premier Oil PMO Trading Chart Review
    • ►  November (4)
      • SHIP Finance SFL Trading Chart Review
      • Exxon Mobil Trading Chart Review XOM
      • Animal Care ANCR Trading Chart Review
      • Editas EDIT Trading Chart Review
    • ►  October (5)
      • Autonation AN Trading Chart Review
      • Agnico Eagle Mines Ltd Trading Chart
      • Marvel MRVL Trading Chart Review - long Term View
      • Qualcomm Trading Chart Review
      • VANDA VNDA Trading Chart review
    • ►  September (4)
      • Morrison's MRW Trading Chart review
      • Fresnillo FRES Trading Chart review
      • Procter & Gamble PG Chart Review - New 52 week High
      • Oracle Trading Chart Review ORCL
    • ►  August (4)
      • EATON Corp. ETN Trading Chart
      • Kulicke & Soffa Industries KLIC Trading Chart
      • Taylor Wimpey Trading Chart Review
      • Van Elle trading chart moves up
    • ►  July (5)
      • PureTech Health PRTC Trading chart - potential cha...
      • Gilead GILD Trading Chart - potential recovery
      • Consol Energy Trading Chart CNX - potential revers...
      • Meet Group Trading chart - Potential to move to th...
      • Cree Trading chart - possible Break Out to upside
  • ►  2015 (4)
    • ►  July (1)
    • ►  June (2)
    • ►  January (1)
  • ►  2014 (9)
    • ►  November (1)
    • ►  September (1)
    • ►  June (2)
    • ►  April (3)
    • ►  February (1)
    • ►  January (1)
  • ►  2013 (16)
    • ►  December (2)
    • ►  November (2)
    • ►  October (1)
    • ►  August (3)
    • ►  May (1)
    • ►  April (4)
    • ►  March (2)
    • ►  February (1)

Total Pageviews

Simple theme. Theme images by Petrovich9. Powered by Blogger.